Sydney Property price movements are not as straight forward as some people may think.
Sydney is a very large area, with very different price movements between the three main areas, Inner Sydney, Middle Sydney and Outer Sydney.
It is quite common to read that Sydney is heading for, or has even hit the $1,000,000 median property price. But that figure would relate only to Inner Sydney.
In the last 5 years, between June 2005 and June 2010, according to RPData Sydney property prices have changed by between a rise of 11.9% per year (Wollstonecraft, North Sydney) and a drop of 5.8% per year (Killcare Heights, Gosford).
During these 5 years, in total:
- Inner Sydney, on average, has risen by 32.5%
- Middle Sydney, on average, has risen by 17%
- Outer Sydney, on average, has risen by 5.5%
The following charts show the details for these areas:
Sydney Median House Prices 2005-2010
| Year | Greater Sydney | Inner Sydney | Middle Sydney | Outer Sydney |
| 2005 | $493,500 | $830,000 | $624,000 | $402,670 |
| 2006 | $480,000 | $840,000 | $610,000 | $386,000 |
| 2007 | $488,000 | $890,000 | $620,000 | $385,000 |
| 2008 | $505,000 | $975,000 | $665,000 | $389,740 |
| 2009 | $465,000 | $926,000 | $620,000 | $380,000 |
| 2010 | $550,000 | $1,100,000 | $730,000 | $425,000 |
Sydney Median Unit Prices 2005-2010
| Year | Greater Sydney | Inner Sydney | Middle Sydney | Outer Sydney |
| 2005 | $380,000 | $453,750 | $365,000 | $325,000 |
| 2006 | $375,000 | $446,000 | $365,750 | $315,000 |
| 2007 | $380,000 | $465,000 | $365,000 | $310,000 |
| 2008 | $393,000 | $491,000 | $382,000 | $305,775 |
| 2009 | $380,000 | $480,000 | $380,651 | $300,000 |
| 2010 | $425,000 | $540,000 | $420,500 | $325,000 |
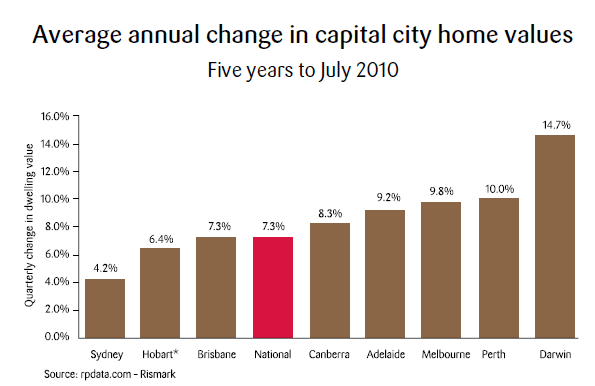
And then, to compare with the rest of Australia, this graph shows the average annual property growth for each capital city.

347.1 - 883,786